

I thought it might be more practical to share here for those who have a hard time finding my analyses that I share on Twitter. At least if we don't like it, we can go back to the old order 🙂 ðŸ™'
I wanted to share the analysis on #SNGYO for a long time. This share has hurt a lot in its time and scared small investors. Let's examine the structure together.
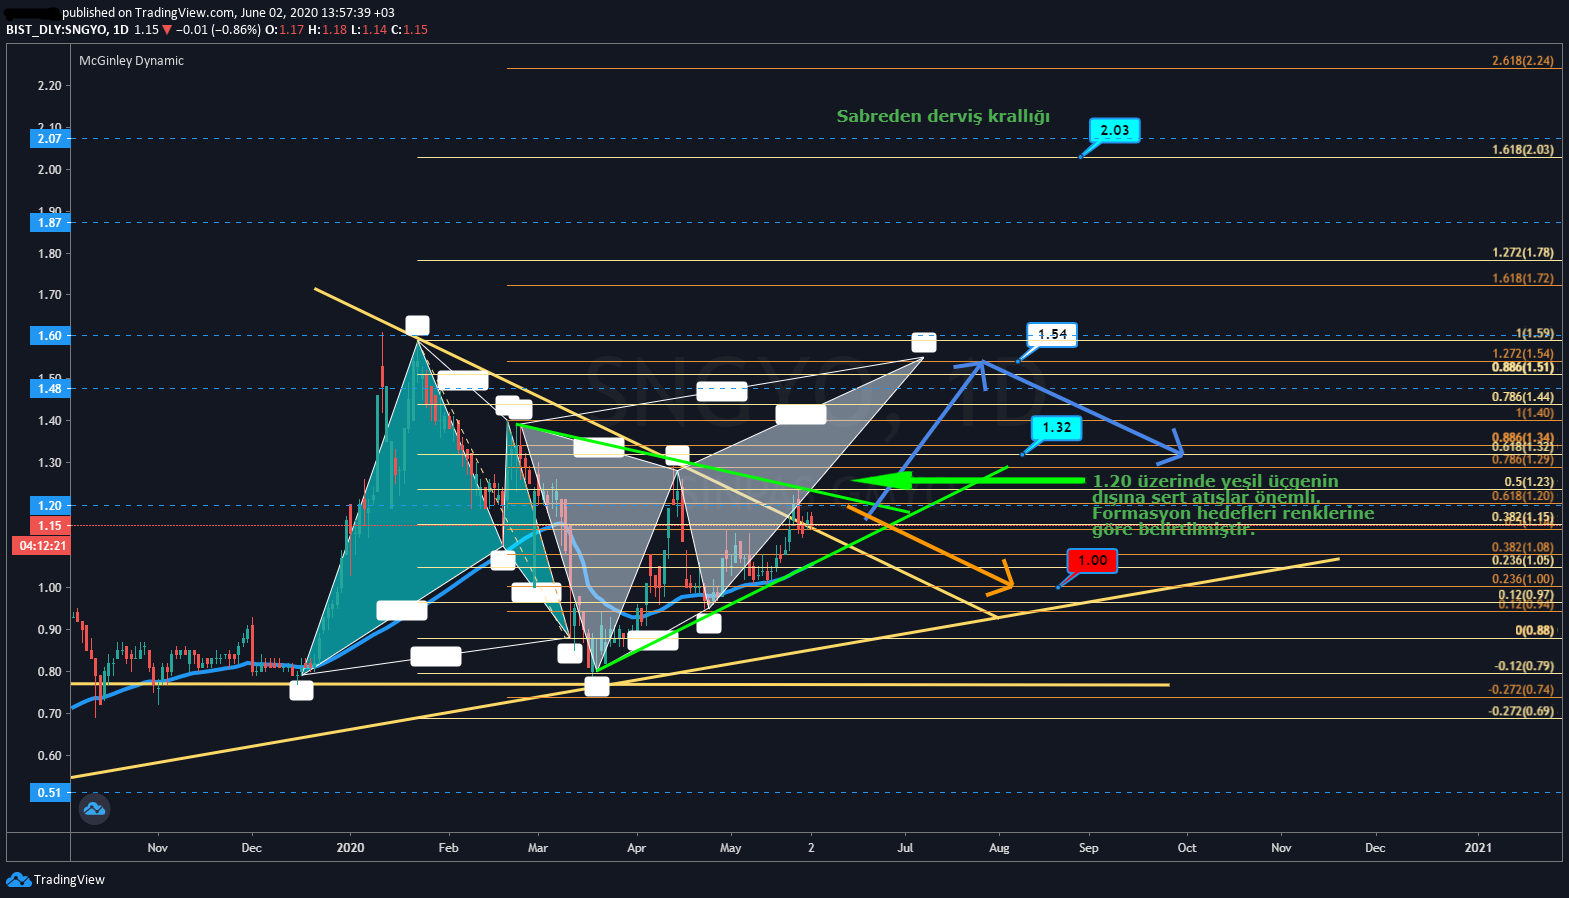
The blue-toned harmonic structure indicates the beginning of the bull. It has already given an opportunity to buy at 0.89. I showed the targets in the same color tone respectively.
Right next to this structure, there is a harmonic structure that has not yet completed its formation and has the possibility of a bear when it is completed. If this structure is formed, a retracement will occur after 1.54.
Hard candle exits above the green triangle are important for the realization of the above two possibilities. It is necessary to follow it well
The last scenario is the possibility of pullbacks, which some do not want and some see as an opportunity. The fibonacci support points you see on the chart should be followed.
Important note If you are going to invest 1000 shares, make it a habit not to buy x shares at one price. Fragmented buying is important to keep the cost down. You will not miss the opportunities of possible pullbacks. Think about your investment at least in the medium term, not instantaneously. Take your time, remember our most important motto is "patience".
Time is our most precious asset. Therefore, I contributed to you by taking my time. If you do not withhold your shares and likes in return for this effort, you will help me keep my motivation for the next time.
Thank you
Final Note: All the details I provide here are for educational purposes and do not contain investment advice. You can send your questions and suggestions here or on twitter.
 Bitcoin
  Ethereum
  Tether
  BNB
BNB  USDC
USDC  XRP
XRP  Solana
  TRON
TRON  Figure Heloc
  Hyperliquid
  Dogecoin
  USDS
USDS  LEO Token
  Zcash
Zcash  WhiteBIT Coin
  Cardano
  Stellar
  Canton
  Bitcoin Cash
  USD1
USD1  Ethena USDe
  Litecoin
  Global Dollar
  Circle USYC
  Hedera
  Shiba Inu
  Sui
Sui  Avalanche
  BlackRock USD Institutional Digital Liquidity Fund
  Ondo US Dollar Yield
  NEAR Protocol
  Ondo
Ondo  Bittensor
  PAX Gold
  OKB
OKB  World Liberty Financial
  Aster
Aster  Ripple USD
  HTX DAO
  USDD
USDD  MemeCore
  Aave
Aave  Falcon USD
  Sky
Sky  BFUSD
BFUSD  Polkadot
  Audiera
  Pepe
Pepe  USDGO
USDGO  Worldcoin
  Spiko EU T-Bills Money Market Fund
  Spiko Amundi Overnight Swap Fund (EUR)
  KuCoin
  Stable
  Quant
Quant  Janus Henderson Anemoy Treasury Fund
  Pi Network
  JUST
JUST  POL (ex-MATIC)
  Ethena
  Pump.fun
  NEXO
NEXO  Render
  Algorand
  Gate
Gate  Janus Henderson Anemoy AAA CLO Fund
  Cosmos Hub
  Beldex
  Jupiter
  币安人生 (BinanceLife)
  YLDS
YLDS  Venice Token
  Lighter
  Filecoin
  Usual USD
  Flare
Flare  Arbitrum
  TrueUSD
  Aptos
Aptos  A7A5
A7A5  Injective
  EURC
EURC  Aerodrome Finance
  Ether.fi
  VeChain
  Ondo Short-Term U.S. Government Bond Fund
  Pudgy Penguins
  Virtuals Protocol
  USDtb
USDtb  Official Trump
  Unibase
  Sun Token
  Curve DAO
  Pyth Network
  Kinesis Gold
  KAITO
KAITO  SPX6900
  Artificial Superintelligence Alliance
  Lido DAO
  Celestia
  apxUSD
  Midnight
  Terra Luna Classic
  LayerZero
  Olympus
  Jito
Jito  AINFT
AINFT  Bonk
Bonk  Monad
Monad  Bitcoin SV
  RealLink
  OnRe Tokenized Reinsurance
  AUSD
AUSD  Peanut
  BCGame Coin
  Legacy Frax Dollar
  Conflux
  Kinesis Silver
  KOGE
KOGE  Plasma
  JasmyCoin
  crvUSD
  Grass
Grass  Decred
  Falcon Finance
  Tradable NA Rent Financing Platform SSTN
  Ape and Pepe
  FLOKI
FLOKI  Optimism
  DoubleZero
  VanEck Treasury Fund
  Velvet
  coco
coco  Starknet
  Pieverse
  FGRS (Figure Tokenized Stock)
  Ultima
  WeFi
WeFi  Zebec Network
  Ethereum Name Service
  Bitway
  Re Protocol reUSD
  BUILDDon
  Kaia
Kaia  Telcoin
  Tradable APAC Diversified Finance Provider SSTN
  Spiko US T-Bills Money Market Fund
  Raydium
  The Graph
  apyUSD
  USDai
USDai  Compound
  Spiko Amundi Overnight Swap Fund
  Trust Wallet
  MX
MX  EUR CoinVertible
  THORChain
  Lido Earn ETH
  dogwifhat
  IOTA
IOTA  ApeCoin
  Chiliz
Thank you
As I understand it;
If we start to watch at 1.20 levels when we look at the white tone; If the candles rise out of the green triangle with longer and harder movements, the first target is 1.54. 1.32 is a possible regression after 1.54.
If there are no hard candle exits, the bearish scenario will be realized. So it may go down to 1.00 levels.
Thank you.